The Return of Oil…

Created with Perplexity
Key Themes Driving Oil Higher
AI Computing
Precious Metal Mining
Slower Adoption of Renewables
The IEA projects that global data center electricity consumption will almost double over the next five years, rising by approximately 500 terawatt-hours. To put this surge in context, one TWh could power about 100 million U.S. homes for one hour—underscoring how significant this increase truly is.

From IEA
In the U.S., the IEA estimates that natural gas will be the primary source of the additional energy supply for data centers, increasing from ~100 TWh in 2025 to ~225 TWh by 2035. This substantial rise could strain natural gas supply, potentially triggering a supply crunch and driving prices upward.

From IEA
Precious metals have surged recently, with gold gaining over 35% and silver soaring more than 45% year-to-date. These significant increases are likely to motivate metal miners to ramp up production, a process that demands substantial fossil fuel consumption.
Historically, silver prices have led WTI crude oil prices, as illustrated in the chart below; however, this year WTI prices have declined while silver continues to rally, creating a notable divergence between the two. If historical trends realign, this gap suggests a potential sharp rise in oil prices ahead.
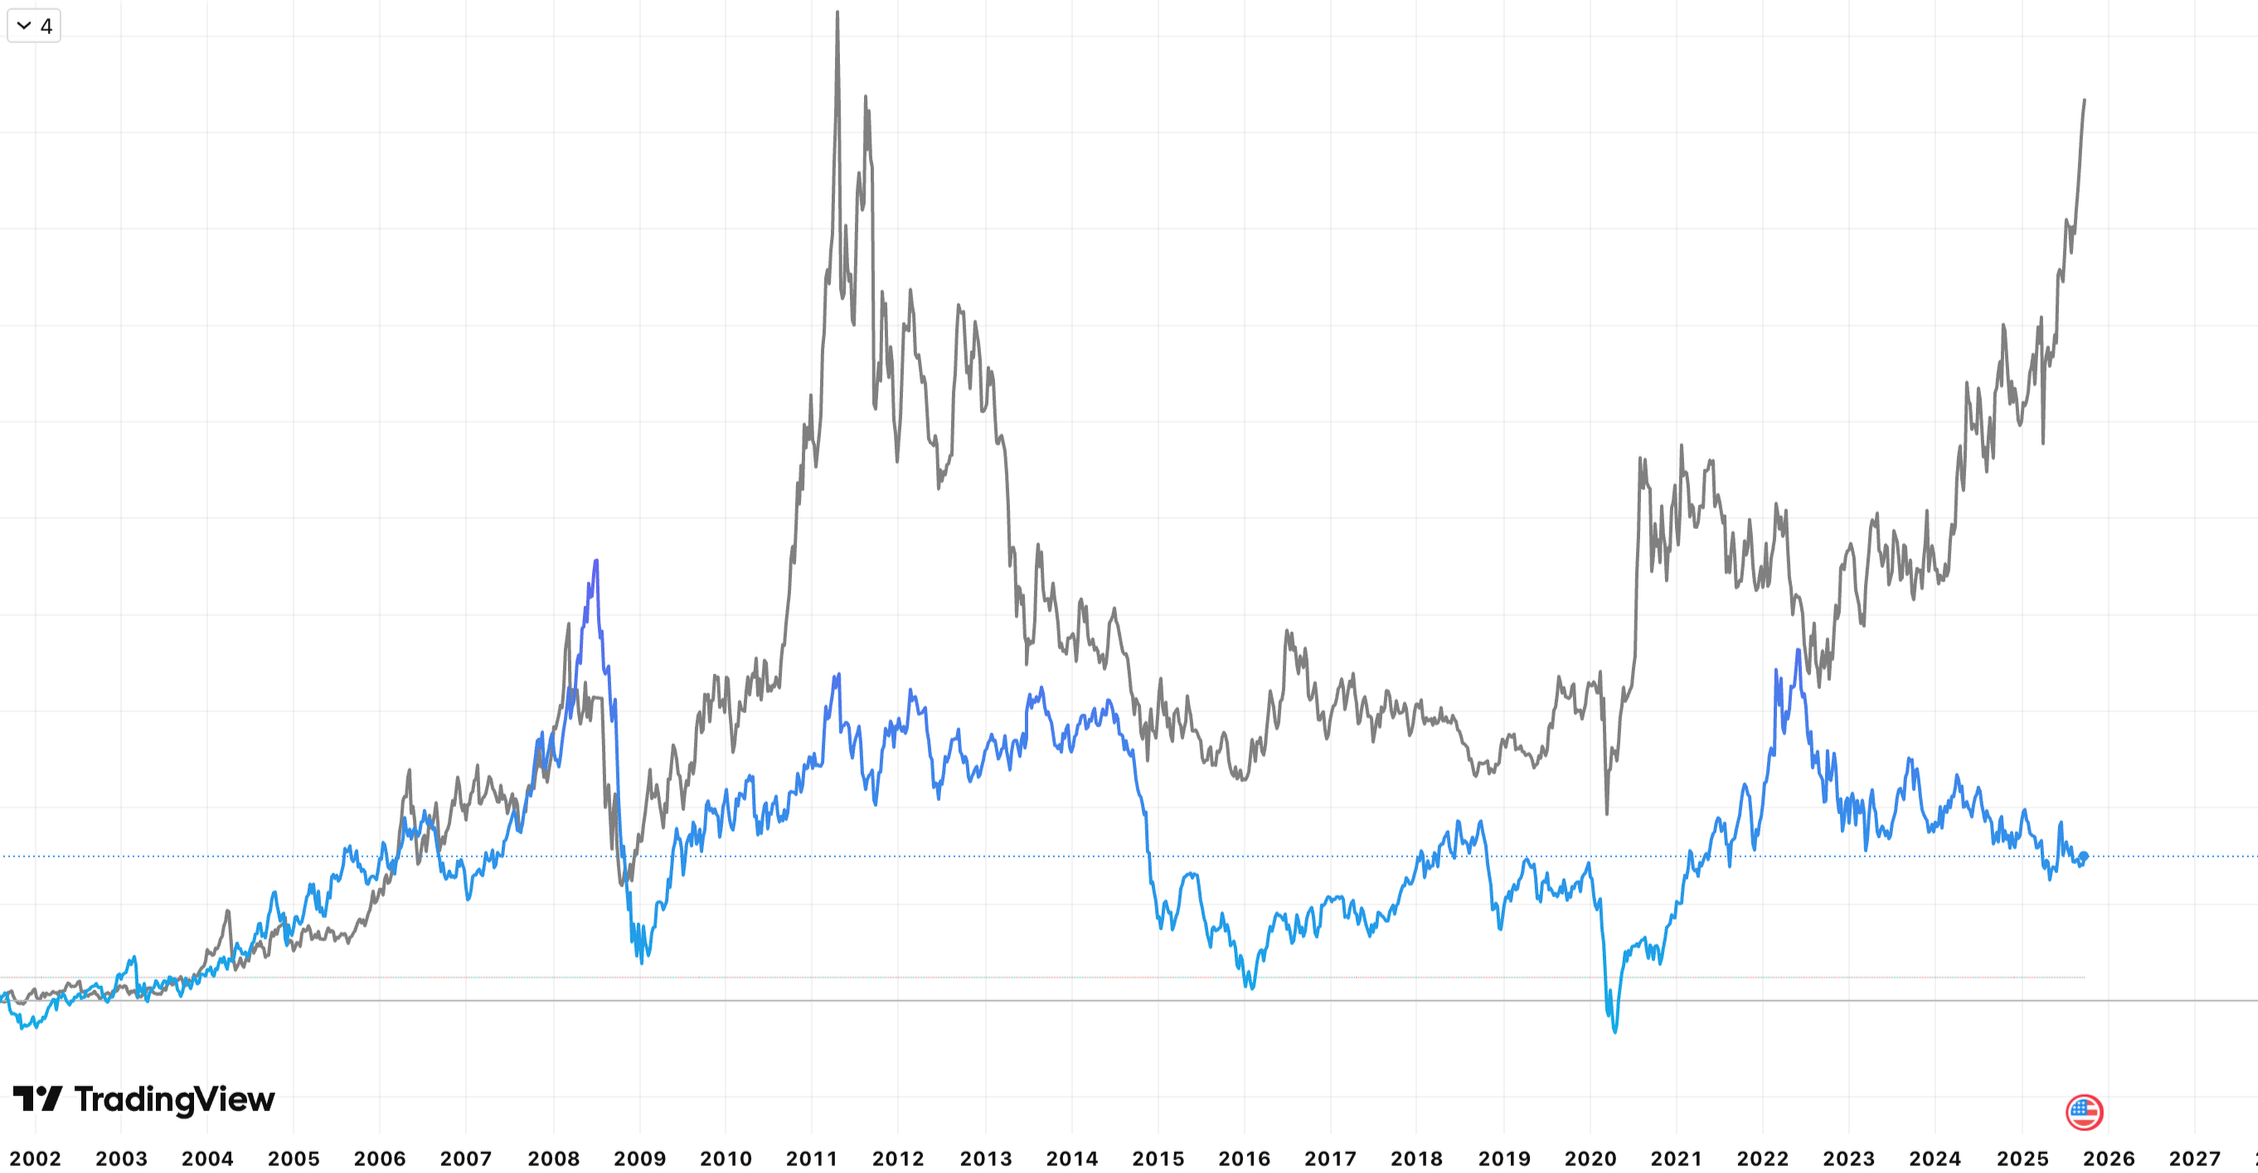
Created with TradingView, Silver in Grey, WTI in Blue
The recent UN meeting made it clear that President Trump favors fossil fuels over renewable energy, as highlighted by his remarks reported by AP “Trump called renewable sources of energy like wind power a ‘joke’ and ‘pathetic’”
Coal is expected by ExxonMobil to be the major fossil fuel loser over the next 20 years, while oil and natural gas continue to be the largest power source.

From ExxonMobil
While debates over renewable energy’s merits continue, Trump’s focus is on expanding fossil fuel production rather than increasing incentives for renewables. An easing regulatory environment for oil producers is expected to reduce costs and boost efficiency. Should renewable energy’s share in the near-term energy mix fall short of projections, the gap will need to be filled by increased production of oil, coal, and natural gas.
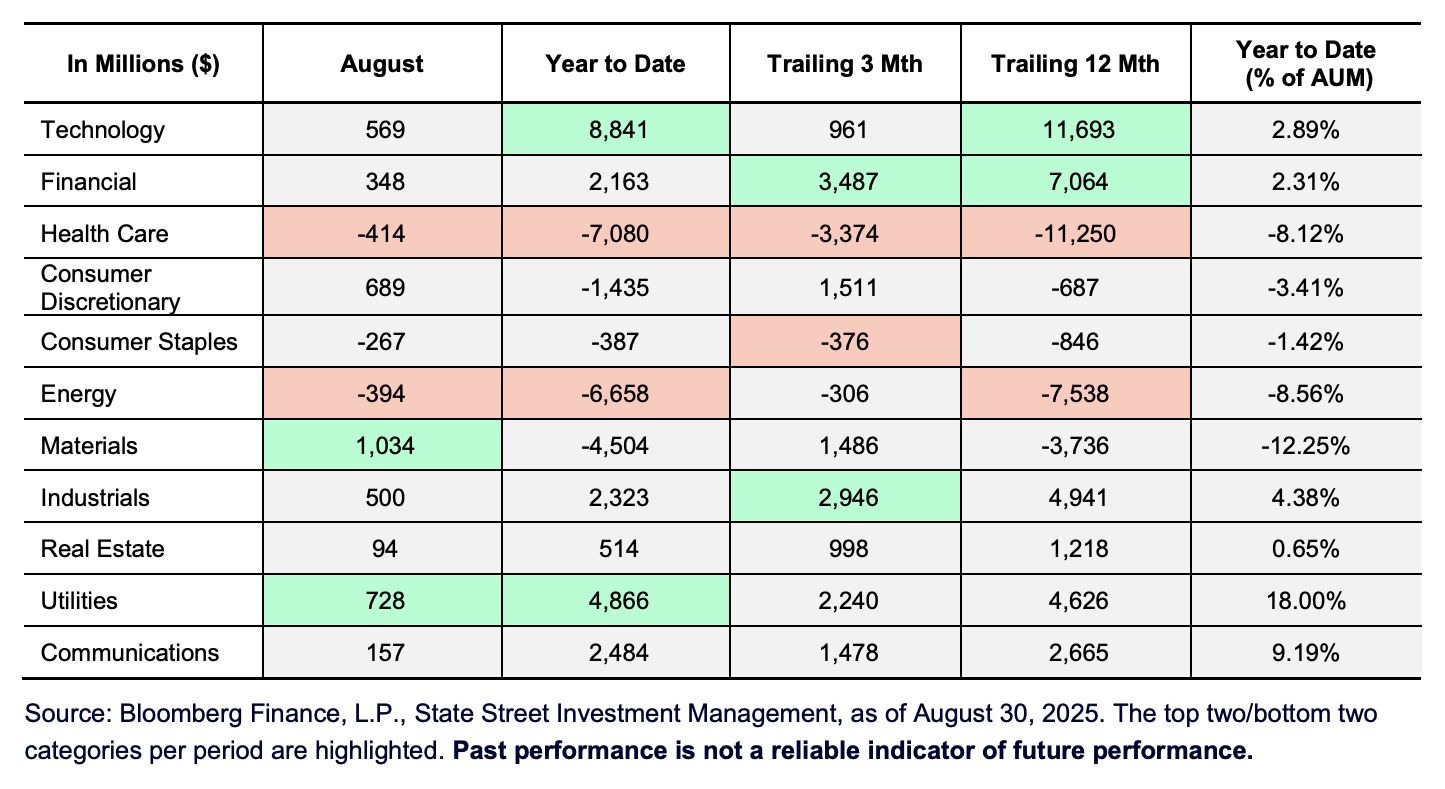
From State Street Investment Management
While the backdrop is setup for continued reliance on fossil fuels, the energy sector has had the second most outflows YTD only ahead of healthcare.
Devon Energy (DVN)
Devon Energy is a leading U.S. based oil and natural gas exploration and production company with a strategic focus on some of the most prolific hydrocarbon basins in the country. The vast majority of their oil and gas production comes from the Delaware Basin, which spans west Texas and southeastern New Mexico, known for its rich reserves and high-margin resource potential. Devon’s second-largest producing area is the Anadarko Basin in Oklahoma, a key region that contributes significant natural gas and oil volumes.
The company’s disciplined operational approach and investment in advanced drilling technologies position it well to capitalize on resource development opportunities across these core assets while maintaining a strong emphasis on operational efficiency.

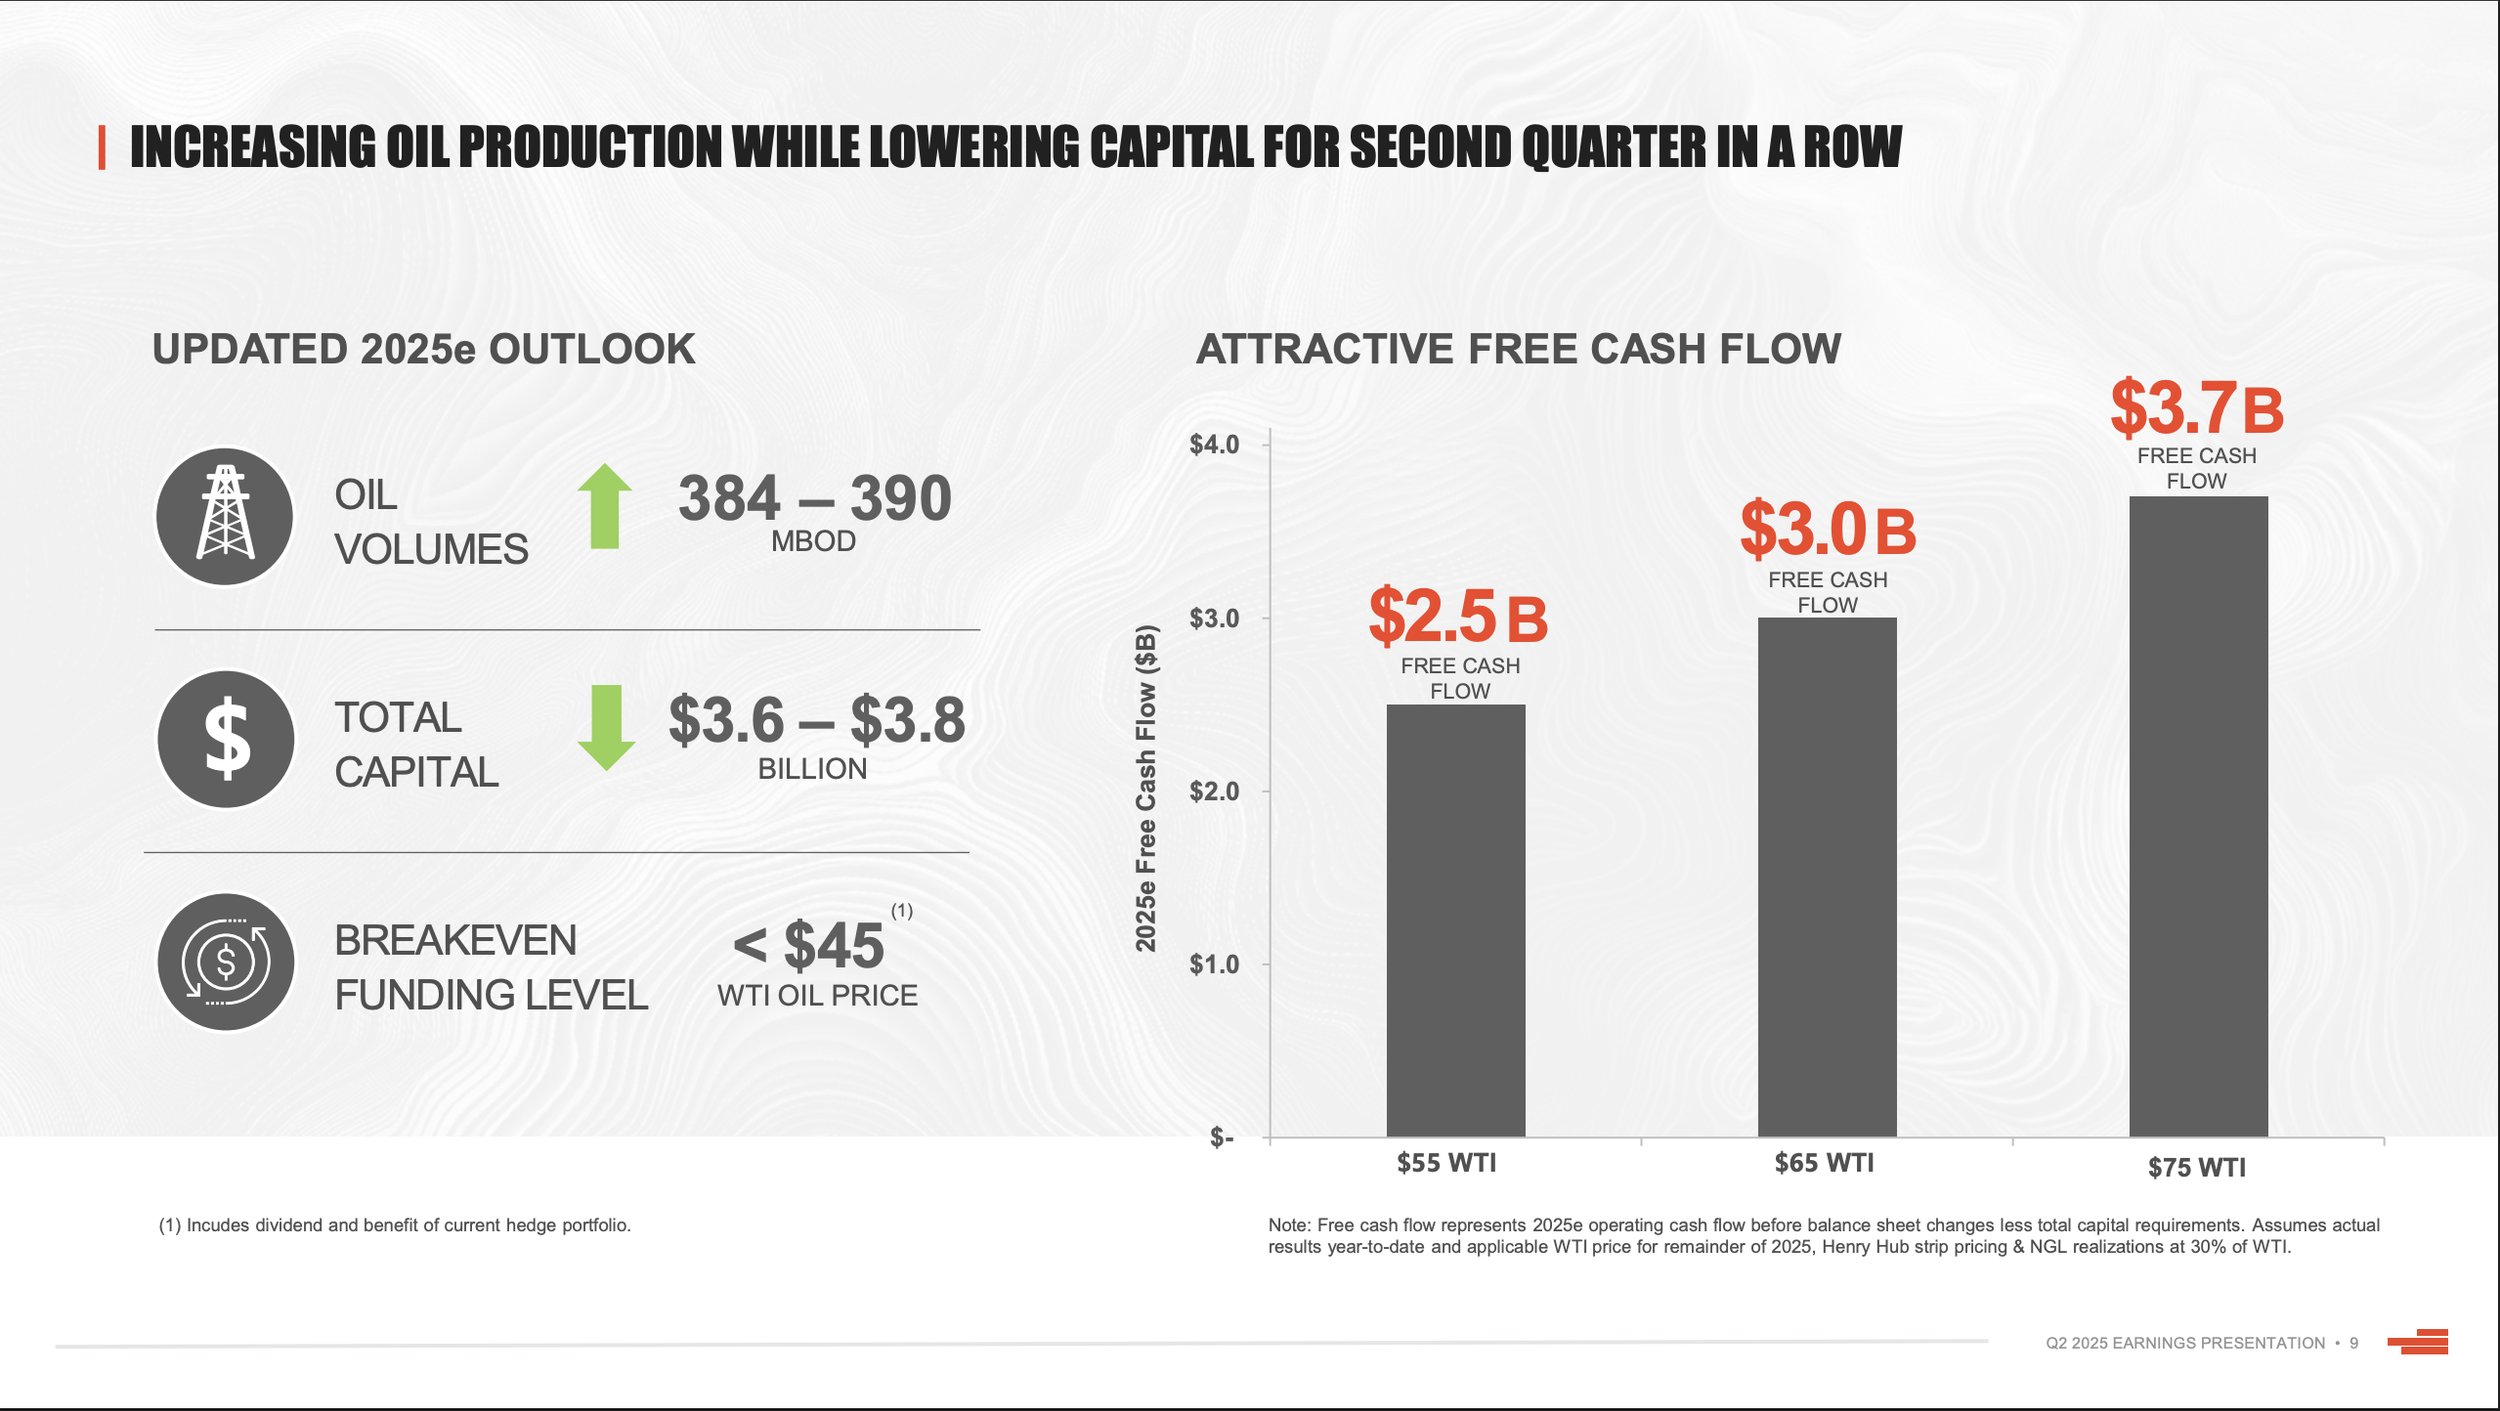
Devon Q2 2025 Earnings Presentation
Looking at the chart of DVN below, they have just broken above a ~1.5 year downtrend with an inverse head and shoulders basing pattern.

Created with StockCharts
If Crude WTI were to remain in the $65 per barrel range, Devon estimates they would earn $3.0B in Free Cash Flow in 2025. That would be a FCF Yield of >13.0% based on a market cap of 22.5B. At the higher end of their internal estimates with WTI at $75 per barrel, they estimate $3.7B in FCF annually. This scenario represents a FCF Yield of >16.0%. Wall Street has FY 2026 FCF estimates at ~$3.15B, which would be in line with a low $60s per barrel in 2026.
With an estimated $3.7 billion in FCF if WTI crude reaches $75 per barrel, Devon's FCF would exceed 2022 levels by $300 million when the stock was trading just under $80 per share.
A return to those price levels from the current ~$35 per share would represent a potential gain of ~125%, underscoring the significant earnings power the business holds if commodity prices recover.
Despite this upside potential, current valuation metrics remain at trough levels amid Wall Street’s bearish outlook on WTI for 2026. DVN trades at 8.2x FY 2026 earnings estimates and at 3.9x FY 2026 EV/EBITDA estimates.
Should commodity prices remain subdued, Devon's strong balance sheet provides a cushion, with net leverage expected to fall below 1.0x Net Debt/EBITDA by the end of fiscal 2025, supported by no material debt maturities until 2030 and beyond.
Devon Q2 2025 Earnings Presentation
Estimating 2026 FCF at ~$3.8B which would assume WTI to be in the high $70’s and a P/FCF of 8.0x or FCF Yield of 12.5% the target price would be $49.35.
Estimating 2026 EBITDA at ~$7.8B which is higher than the Street at ~$7.4B and a EV/EBITDA multiple of 5.0x the target price would be $55.19.
The average of these models is $52.27 and represents a ~48.5% capital appreciation.

McClure Private Wealth - Estimates

Devon Q2 2025 Earnings Presentation
For 2025 estimates Devon lowered CapEx while increasing productions volumes showing the recent rig and well improvements are driving substantial production efficiencies.

Devon Q2 2025 Earnings Presentation
Devon currently has 30% of their oil production hedged with derivatives incase of a further decline in prices. This is how they are able to get their breakeven level at $45 per barrel. These hedges reduce downside risk, but also limit some of the upside that peers without hedges will have.
Devon implemented a fixed + floating dividend policy in 2021 that fluctuates based on the performance of commodity prices. Currently the fixed amount is $0.24 per share per quarter with no variable portion.
This combination of disciplined capital allocation, a robust balance sheet, and attractive valuation positions Devon well to capitalize on an improving commodity price environment while managing downside risk effectively.
Disclaimer
This article is for informational and educational purposes only and does not constitute investment advice or a recommendation to buy or sell any security. Readers should conduct their own research and consult with a qualified financial advisor before making any investment decisions. The author and publisher disclaim any liability for any losses or damages incurred as a result of reliance on the information provided herein.
Citations
IEA (2025), Global data centre electricity consumption, by equipment, Base Case, 2020-2030, IEA, Paris https://www.iea.org/data-and-statistics/charts/global-data-centre-electricity-consumption-by-equipment-base-case-2020-2030, Licence: CC BY 4.0
IEA (2025), Electricity generation for data centres by fuel in the United States, Base Case, 2020-2035, IEA, Paris https://www.iea.org/data-and-statistics/charts/electricity-generation-for-data-centres-by-fuel-in-the-united-states-base-case-2020-2035, Licence: CC BY 4.0
Devon Investor Relations https://investors.devonenergy.com/investors/default.aspx
https://apnews.com/article/trump-un-climate-change-renewable-energy-5c033a24ec523a56f8244d85f3672eda
https://www.ssga.com/library-content/pdfs/etf/us/monthly-flash-flows.pdf