Is The Market Overvalued?

Created With Perplexity
Since essentially the GFC in 2007, growth equities have dominated the U.S. market. Alongside this the U.S. markets have dominated the world indexes. It is easy to say it has been fun to be an investor in the U.S. economy over the past 18 years. This excerpt will analyze the current market environment, discuss valuations, and propose positioning ideas.
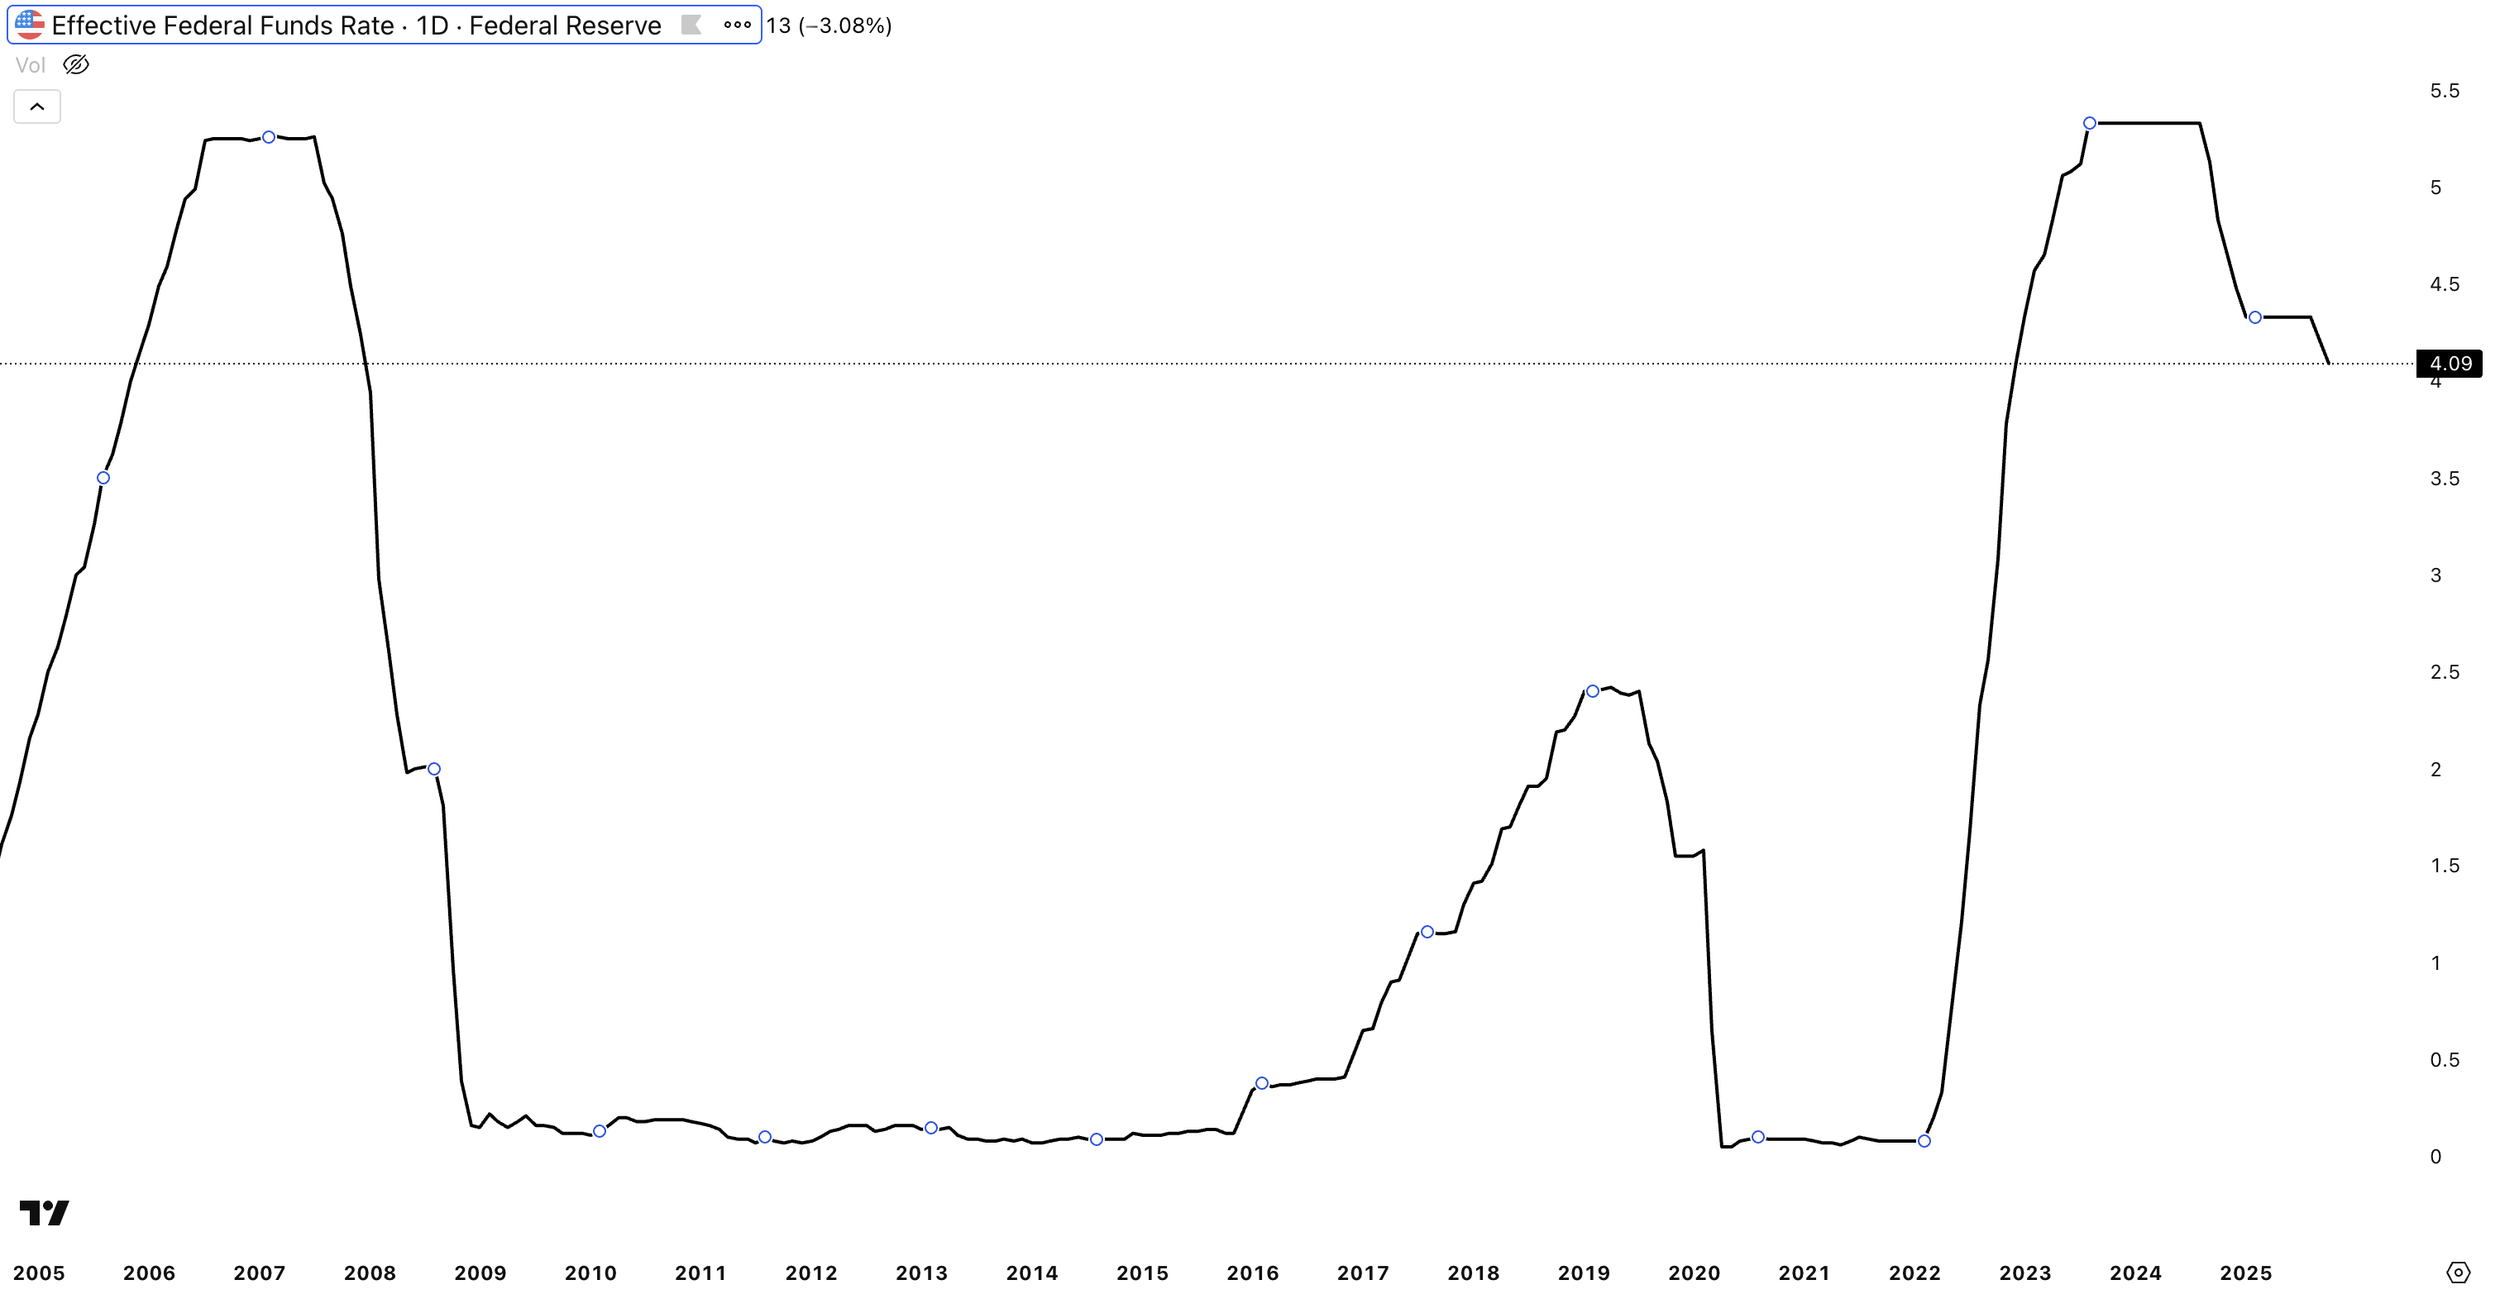
Federal Funds Policy Rate, TradingView
From 2009 to 2017, the federal funds effective rate remained below 0.25%, creating a historically low borrowing cost environment. This easy capital access was key in supporting risk assets, especially unprofitable companies and startups, as the lower discount rates reduced the cost of capital and enhanced valuations. During this period, technology companies capitalized on favorable funding conditions, gradually becoming the largest sector in the S&P 500 , now representing approximately 35% of the index.
As we enter another Federal Reserve easing cycle, it is important to recognize a likely floor on how low rates can go. Inflation, as measured by the Consumer Price Index (CPI), remains elevated at 3.0%, above the Fed's long-term target of 2.0%. This persistent inflationary pressure, compounded by the potential for a rebound in commodities and rare earth prices, serves as a counterweight to aggressive rate cuts.
The market currently anticipates three additional 25 basis point rate reductions by December 2026, which would put the effective federal funds rate at ~3.13%. While this represents a modest easing, it remains moderately higher than the historical average rates experienced over the previous decade. This environment suggests a more disciplined investing stance, which may influence the valuation frameworks applied to risk assets.
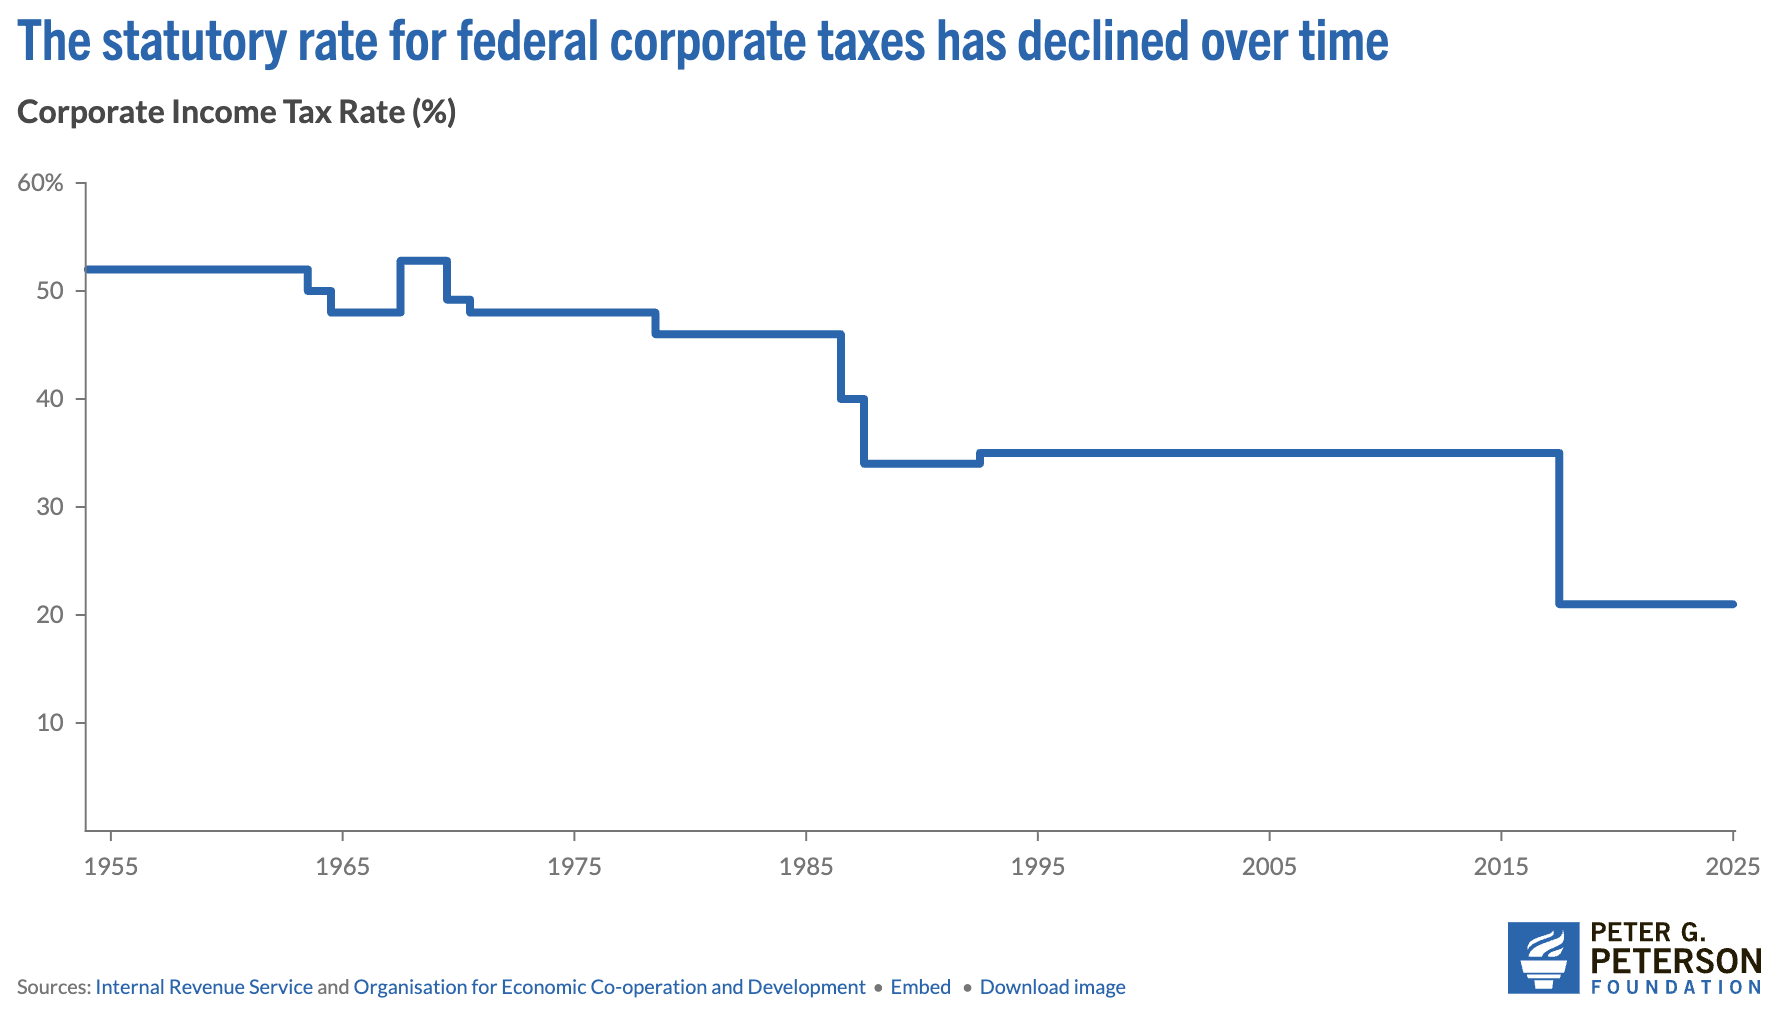
Corporate Income Tax Rate, Peter G. Peterson Foundation
Another significant tailwind for U.S. companies has been the sustained decline in federal corporate tax rates over recent decades. As illustrated in the chart above, this downward trend has provided substantial benefits, particularly to high-margin technology companies that now dominate major U.S. indexes. The most impactful recent change was the passage of the Tax Cuts and Jobs Act (TCJA) in late 2017, which permanently reduced the statutory federal corporate tax rate from 35% to a flat 21%, effective starting in 2018.
“America’s largest, consistently profitable corporations saw their effective tax rates fall from an average of 22.0 percent to an average of 12.8 percent after the Trump tax law went into effect in 2018.” ITEP

iShares U.S. Growth ETF/iShares U.S. Value ETF, TradingView
This chart compares U.S. growth equities to U.S. value equities, showing how this ratio has historically encountered upward sloping resistance around key inflection points in 2001, 2021, 2023 and we now find ourselves within this historical resistance range again. This pattern heightens caution around investing in growth names, which have enjoyed an extraordinary run in recent years.
A critical unknown driving this caution is the return on invested capital (ROIC) for the hyperscale technology giants (Amazon, Google, Meta , Microsoft, and Oracle) particularly in their substantial data center and compute capital expenditures. Last week, Meta raised its capital expenditure guidance for 2026 to around $115 billion, significantly higher than prior forecasts, reflecting an aggressive push to build AI infrastructure and expand compute capacity. This upward revision spooked investors, sending Meta’s stock down roughly 11%, as uncertainties loom around the monetization and returns from these substantial investments.

Forward P/E’s by Market Cap, Yardeni Research
The Magnificent Seven (Amazon, Apple, Google, Meta, Microsoft, Nvidia, Tesla) technology giants have been a major force driving U.S. equity indexes to elevated valuation multiples. Currently, the forward price-to-earnings (P/E) multiple for the S&P 500 hovers above 22x, extending well beyond historical averages.
In contrast, the small-cap and mid-cap segments trade at more normalized multiples, generally in the 15-16x range, which aligns more closely with this century’s average for these market cap brackets.
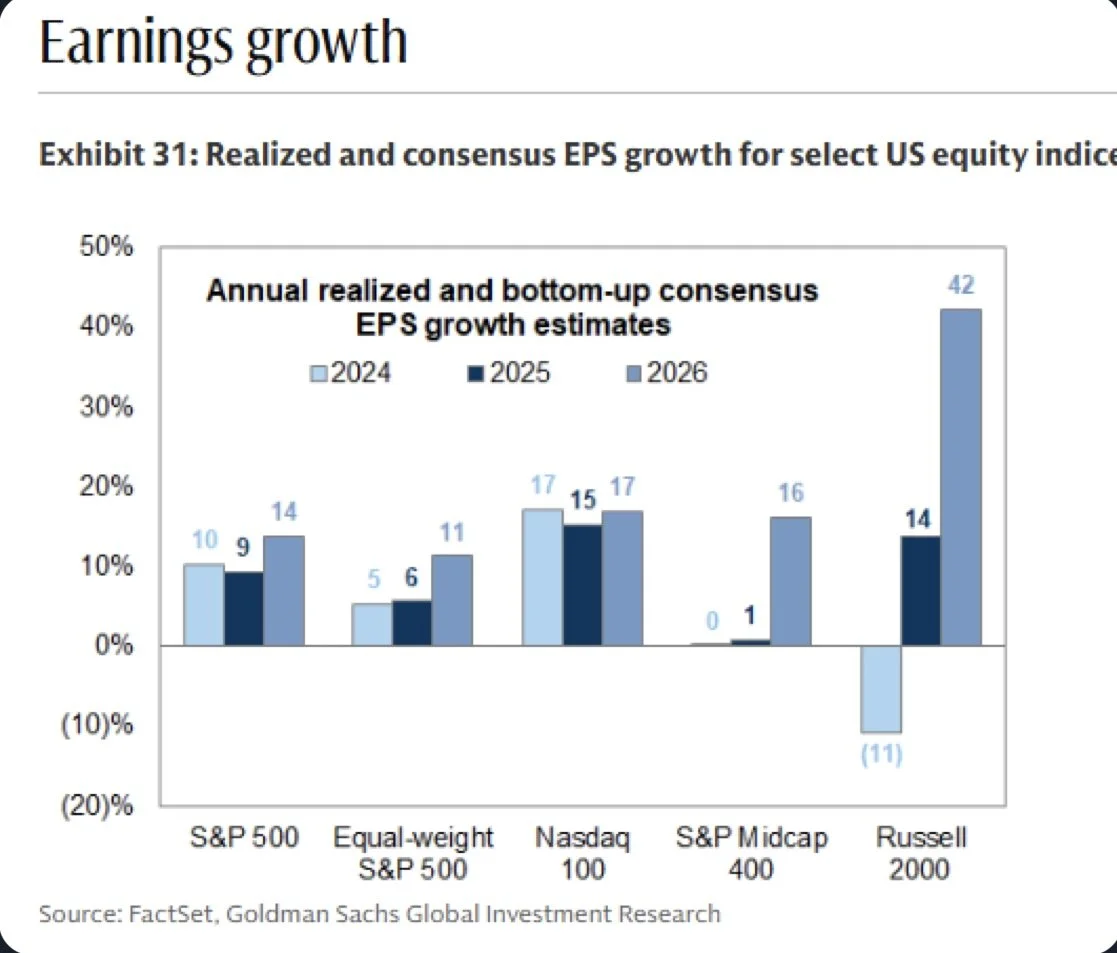
EPS Growth, Goldman Sachs Global Investment Research
The Russell 2000, a key small-cap index, is projected to experience the highest earnings per share (EPS) growth among major market cap segments in 2026, while still trading a normal multiple when compared to its history. This combination of robust earnings growth and attractive valuation sets a favorable backdrop for small-cap equities, particularly as we enter a mild Federal Reserve easing cycle. Historically, small caps tend to benefit disproportionately from easing monetary policy due to their greater sensitivity to economic cycles and borrowing costs.
For the U.S. stock market to sustain its bull run over the longer term, it will be healthy for leadership to transition to new sectors and market segments. Small caps, often more domestically focused and economically sensitive, offer such leadership potential as investor sentiment aligns with favorable monetary policy and improving earnings fundamentals.

S&P 500 (Black), Consumer Discretionary (Blue), Consumer Staples (Green), TradingView
Looking at the chart above, we can see that both of the consumer sectors (staples & discretionary) have significantly underperformed the broader market YTD. Consumer staples is actually negative YTD, which is quite astonishing given the great year for the S&P 500.
Recent commentary from key consumer company executives highlights mounting concerns about consumer sentiment and spending. Kraft Heinz CEO Carlos Abrams-Rivera described the current mood succinctly during their Q3 earnings release: “We now have one of the worst consumer sentiments we have seen in decades.”
Similarly, Chipotle’s leadership noted that "Earlier this year, as consumer sentiment declined sharply, we saw a broad-based pullback in frequency across all income cohorts," Boatwright explained. "Since then, the gap has widened, with low to middle-income guests further reducing frequency. We believe that this guest, with household income below $100,000, represents about 40% of our total sales, and based on our data, is dining out less often due to concerns about the economy and inflation. A particularly challenged cohort is the 25 to 35-year-old age group."Yahoo Finance
And then again from Advance Auto Parts’ CEO, who said “In general, we're keeping an eye on the overall health of the low end -- low to mid-end consumer where -- that's where our customer base is. Broadly, you see some data points that suggest that they may be depressing their spend in aggregate across general merchandise and think about that as the subprime auto market, the general consumer sentiment, where discretionary spend is going, credit cards. And so that impacts how they spend.” on their Q3 earnings call last week.
This is not quite what you want to hear from consumer products companies in the heat of a bull market. It will be important to continue to monitor the consumer as this can be a major hinderance to the bull market.
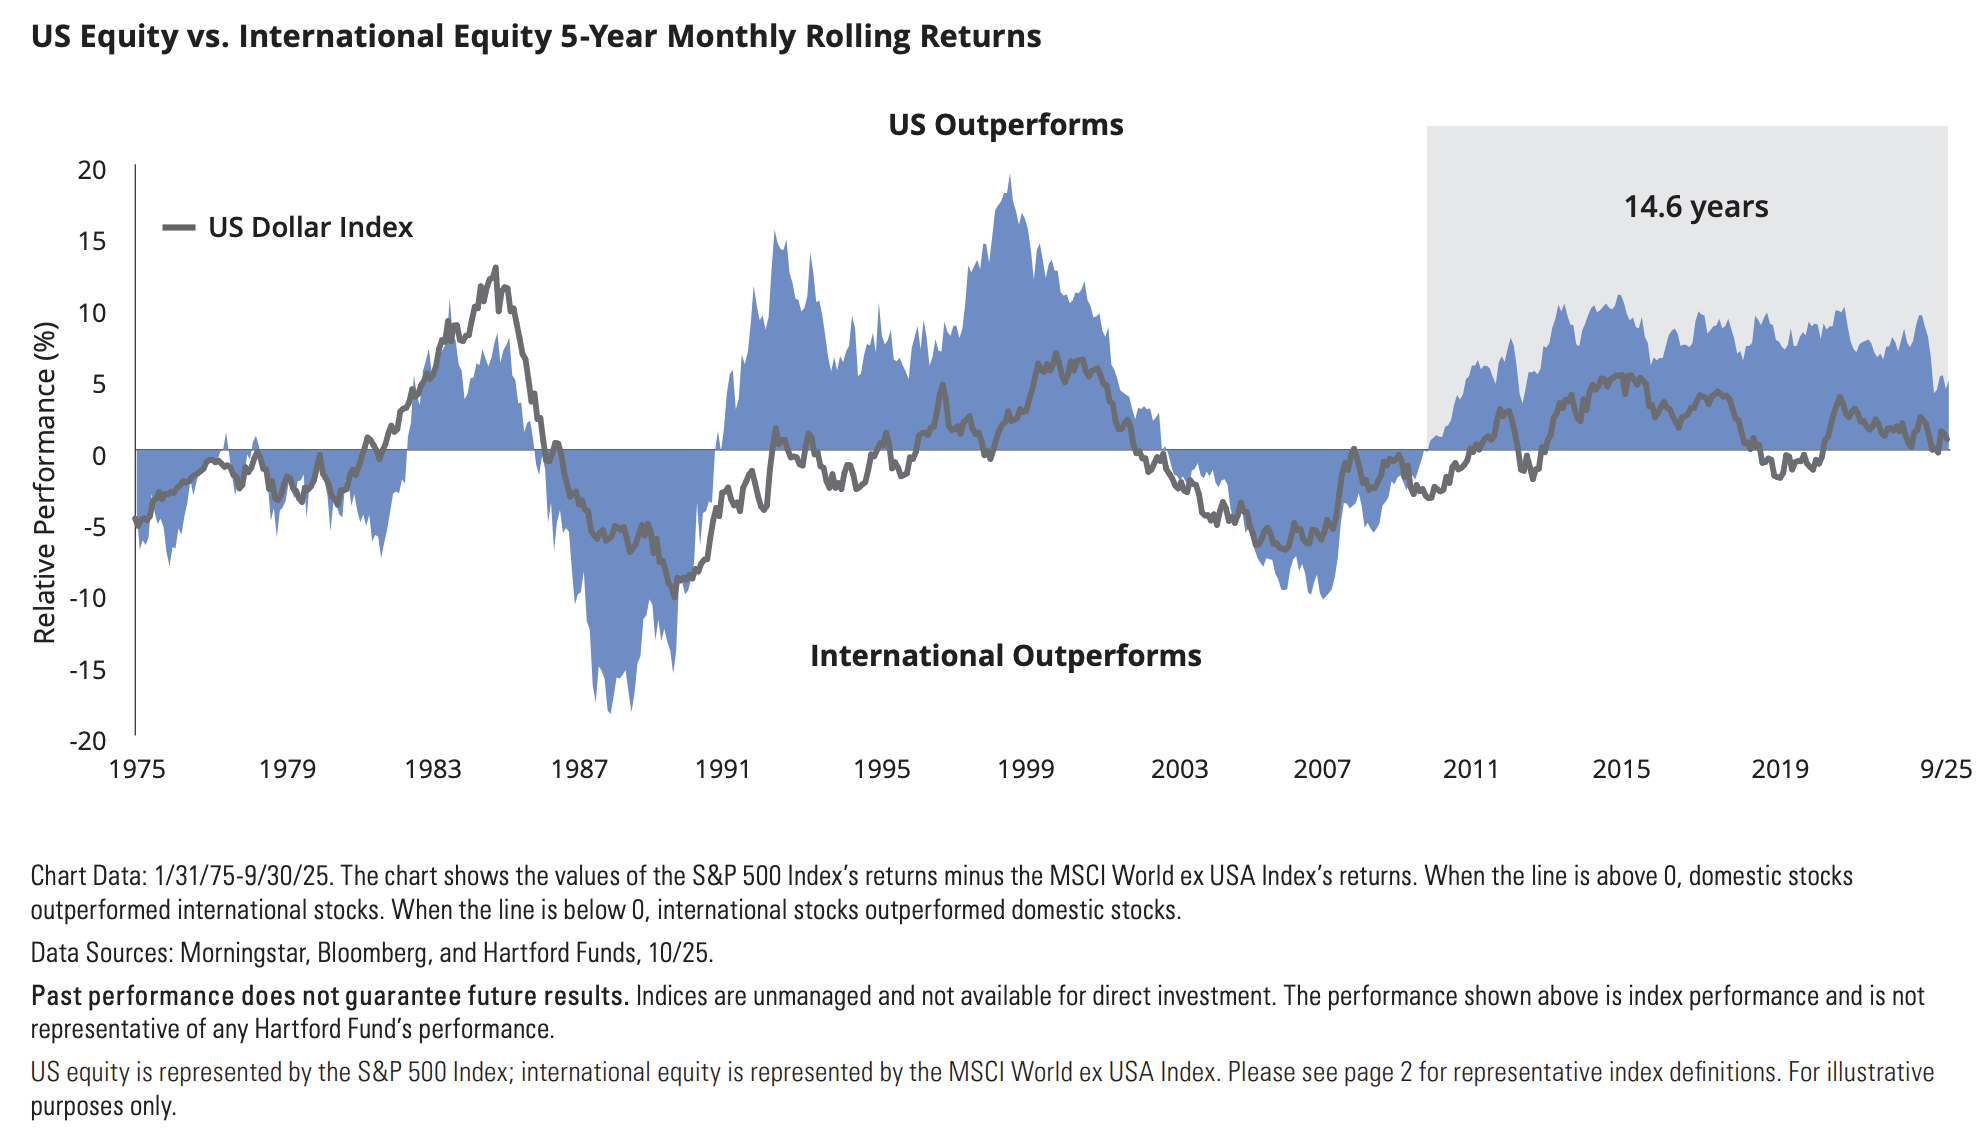
Hartford
“History tends to repeat itself….”
While U.S. equities have enjoyed a period of dominance spanning nearly 15 years, it is important to recognize that markets inherently move in cycles, and we may be approaching the end of this prolonged U.S. leadership phase. Notably, 15 years exceeds the historical average duration of U.S. equity dominance, suggesting a potential rotation on the horizon.
Emerging markets are positioned to play a pivotal role in the next cycle, with forecasts indicating they will outpace global GDP growth by a full percentage point. The International Monetary Fund (IMF) projects emerging markets to achieve approximately 4.0% GDP growth in both 2025 and 2026, surpassing developed market growth rates. This dynamic growth potential, combined with relatively attractive valuations and underrepresentation in global equity indices, presents a compelling case for increased emerging market participation in portfolios.
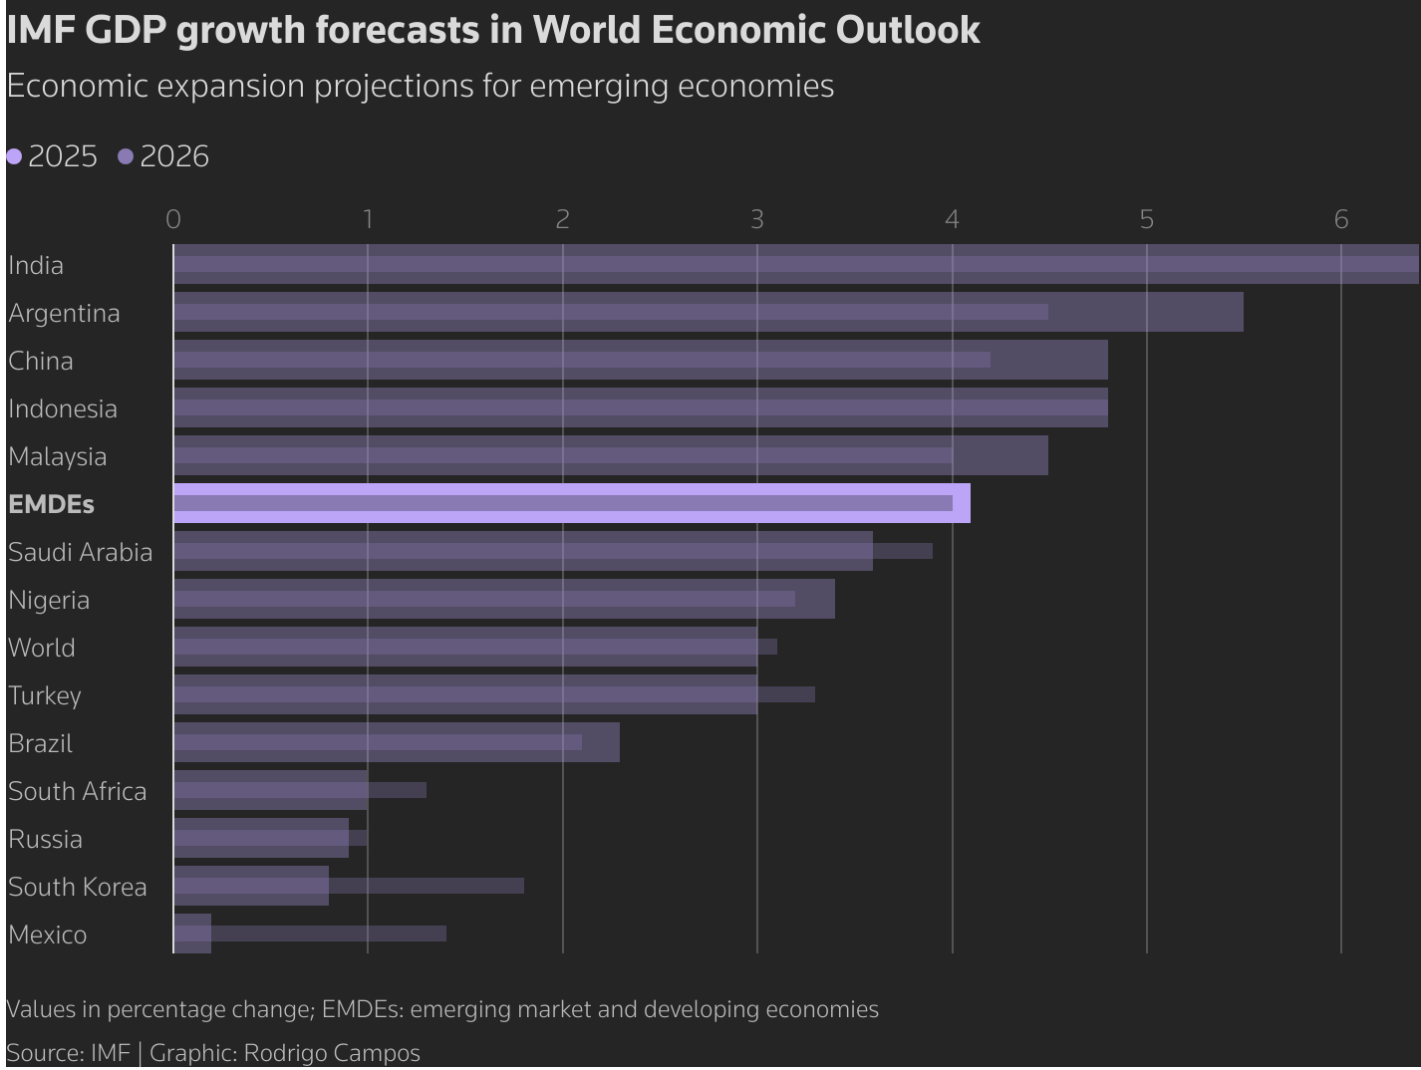
GDP Growth Forecasts, Rodrigo Campos
While it is easy to argue that the U.S. stock market appears overvalued, evidenced by valuation metrics such as the Buffett Indicator standing near 217%, significantly above historical averages, and notably stretched P/E multiples, corporations are currently operating with some of the highest profit margins in history, supported by continued growth tailwinds including technological innovation, and productivity gains.
Looking ahead, the case for the next legs of the bull market lies in segments where participation has been relatively limited so far and valuations remain more attractive. Small caps, value stocks, and emerging markets present compelling opportunities given their historically lower multiples compared to large-cap growth sectors dominated by tech giants.
Coming soon….. a company that checks two boxes, small cap & value
Disclaimer
This article is for informational and educational purposes only and does not constitute investment advice or a recommendation to buy or sell any security. Readers should conduct their own research and consult with a qualified financial advisor before making any investment decisions. The author and publisher disclaim any liability for any losses or damages incurred as a result of reliance on the information provided herein.